1
/
of
2
Modern Data Visualization with R
Modern Data Visualization with R
SKU:9781032287607
Chapman and Hall/CRC
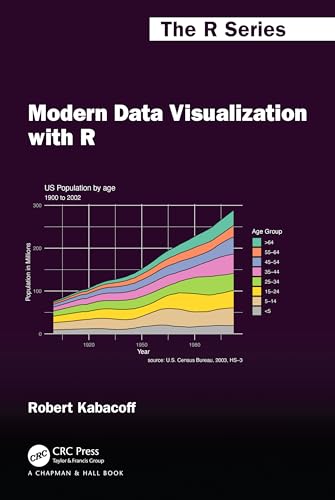
Ways that raw and summary data can be turned into visualizations that convey meaningful insights: basic graphs, bar charts, scatter plots, and line charts, and progresses to tree maps, alluvial plots, radar charts, mosaic plots, grouped dot plots, effects plots, multivariate presentations such as corrgrams, biplots, network diagrams.
Copyright Year: 2024
Couldn't load pickup availability
Share


